Is Singapore in an invisible recession? Six signs in the official numbers
GDP grew 5.4%, yet money feels tight. Brandon from Sum walks through six official figures on spending, prices, jobs and card debt, and what to check.

I was on the North East Line on a Wednesday morning in the middle of October, standing because the train was full, reading the government's first estimate of how the economy did from July to September. It grew 5.4% on a year before. That's a strong number. I remember thinking it was the kind of headline that makes for a calm week at work.
Then my phone buzzed. It was my younger sister in the family group chat. She's a nurse, and there's a small café near her hospital where she and her colleagues get coffee after night shifts. She'd sent a photo of its shutters down, with a handwritten note taped to them, and one line: "Economy grow 5.4% then why my café close?"
I didn't have a good answer before my stop. And honestly, I think a lot of people have the same feeling she did. The headline says the economy is doing well. The bills, the shop closures and the conversations at dinner say something else.
There's a name going around for that gap: an invisible recession. It isn't an official term, and nobody is saying Singapore is in a recession, me included. But the gap is worth looking at properly. So here's the headline number, then six signs from the official pages that explain why daily life can feel tighter, and what's worth checking in your own money.
What people mean by an invisible recession
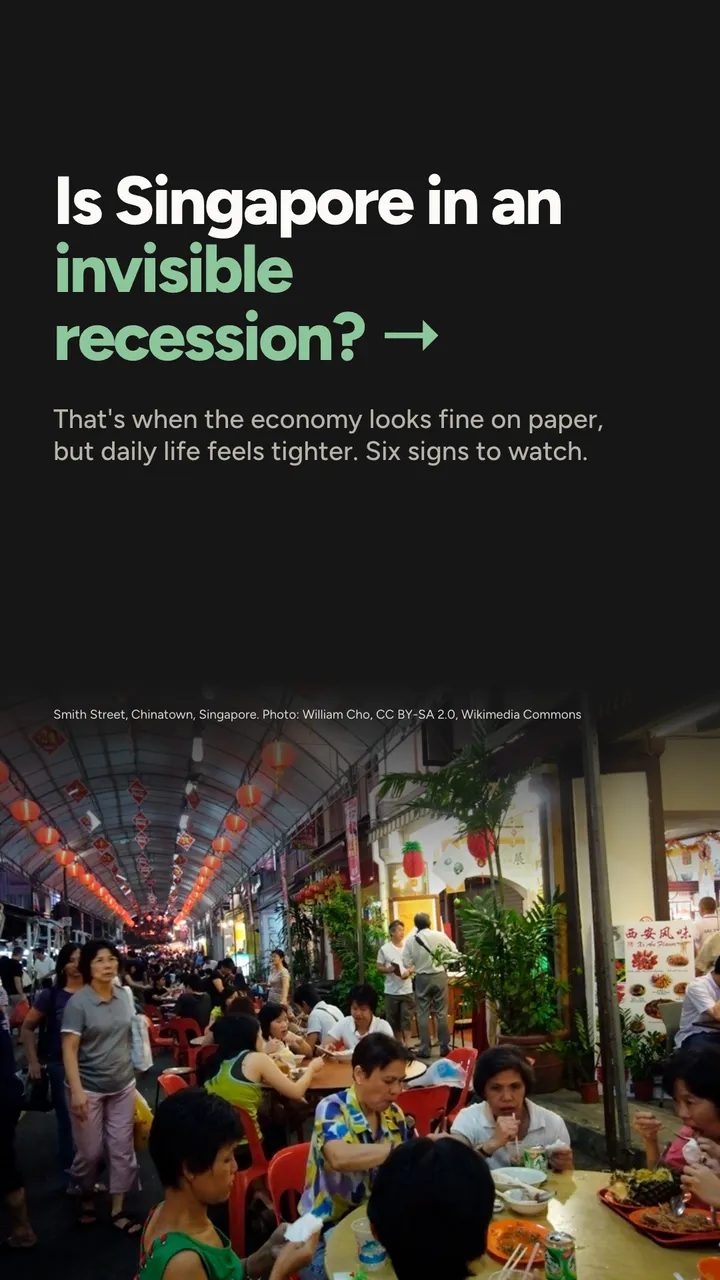
Economists usually call it a technical recession when the economy shrinks for two quarters in a row, compared with the quarter before each time. Output is measured by GDP (gross domestic product): the value of everything produced here in a period.
An invisible recession is a much fuzzier idea. It describes the feeling that things are getting harder for ordinary households while the big number still looks fine. That can happen because GDP is a total: if one part grows very fast, the total can look strong while other parts are flat.
What this means for you
A strong GDP figure tells you about the economy. It doesn't tell you about your household. The figures that come closest to your own life are prices, jobs and what you owe, and those are the next few slides.
On paper, the economy is booming
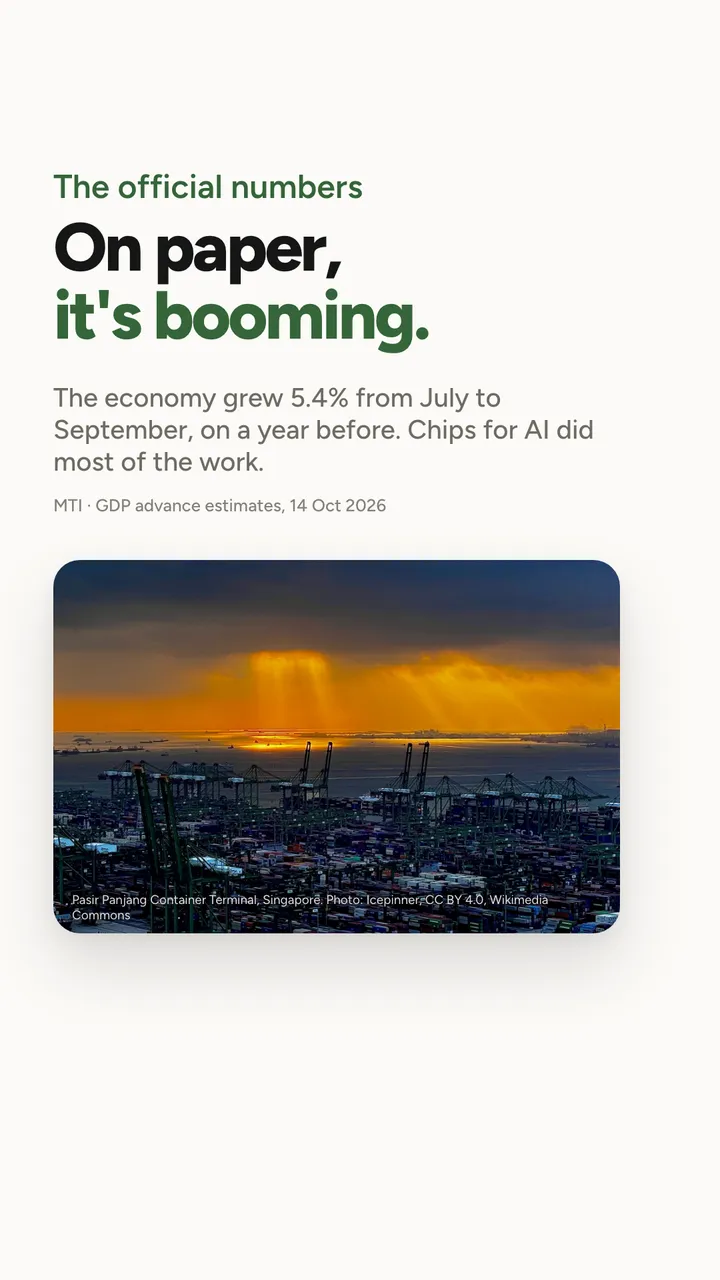
The 5.4% is the Ministry of Trade and Industry's advance estimate of 14 October 2026: a first look, which can be revised later. "On a year before" means it compares July to September 2026 with July to September 2025.
Most of that growth came from one place: chips, the semiconductors that go into data centres. That's genuinely good news for the economy. It's also a narrow source of growth. It's one industry, and the money it makes mostly doesn't pass through the hawker centre.
Here's a way to picture it. Say an economy has two parts, each producing $100 a year. One grows 15% and the other grows 0%. The total goes from $200 to $115 plus $100, which is $215, a rise of 7.5%. Half the economy didn't move at all, and the headline still looks excellent.
What this means for you
When you read a GDP headline, it's worth asking which part of the economy did the growing. If it isn't the part you work in, your own year may feel quite different from the number, and that isn't you reading it wrong.
People still eat out, they just trade down
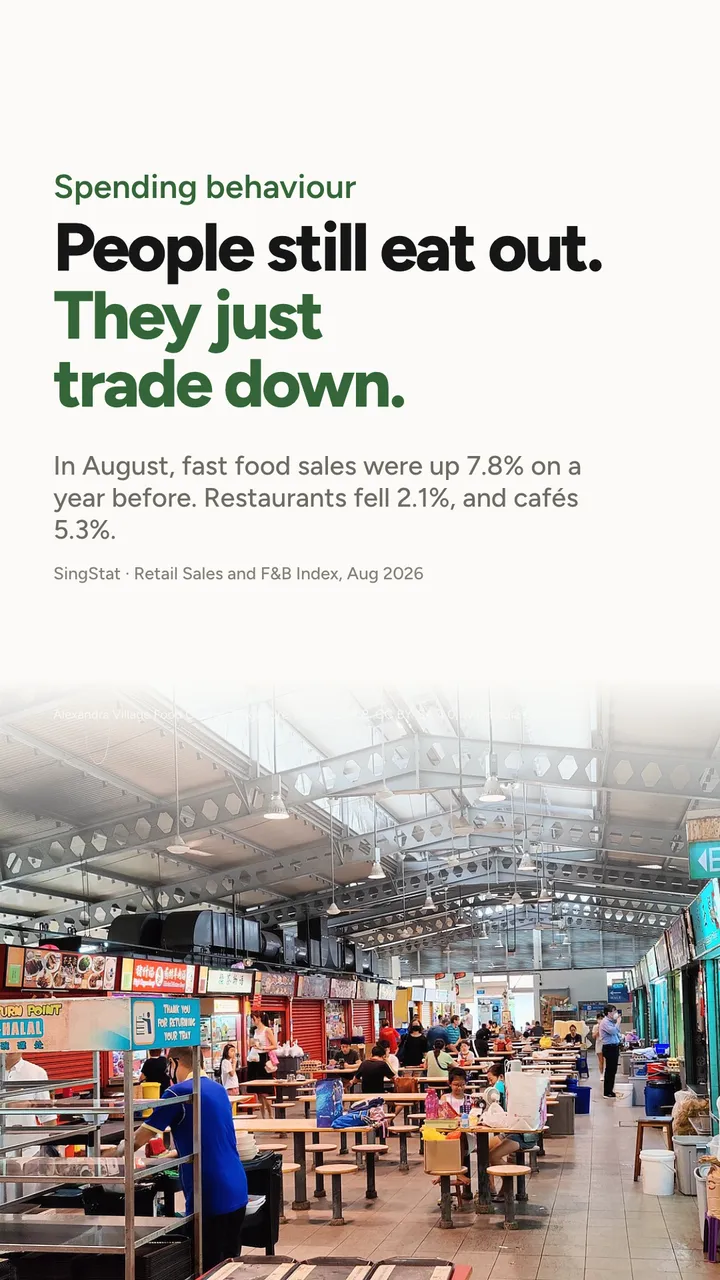
Trading down means you keep doing something but pick a cheaper version of it: dinner with friends at a hawker centre instead of a restaurant, coffee from the coffee shop under the block instead of the café.
SingStat's Food & Beverage Services Index tracks how much F&B places sell. In August 2026, compared with August 2025, fast food sales were up 7.8%, restaurant sales fell 2.1%, and café sales fell 5.3%. People didn't stop eating out. They moved down the price ladder.
It's easy to see why, with a small worked example. Say Marcus, 29, has a weekly dinner with friends. This is made up, but it's an ordinary habit. At a mid-range restaurant he spends about $40 a head. At a fast food place or a hawker centre, about $12. Over a year of weekly dinners, that's $40 times 52, which is $2,080, against $12 times 52, which is $624. The swap saves him $1,456 a year and he still sees his friends every week.
What this means for you
Trading down isn't a failure, it's a decision. The useful part is making it on purpose. If you know what your eating-out category costs in a month, you can choose which dinners are worth the restaurant and which ones aren't. If eating out is a big part of your month, I went through the cost of the delivery version of this in why delivery and ride apps cost more this year.
2,632 food and drink businesses closed this year
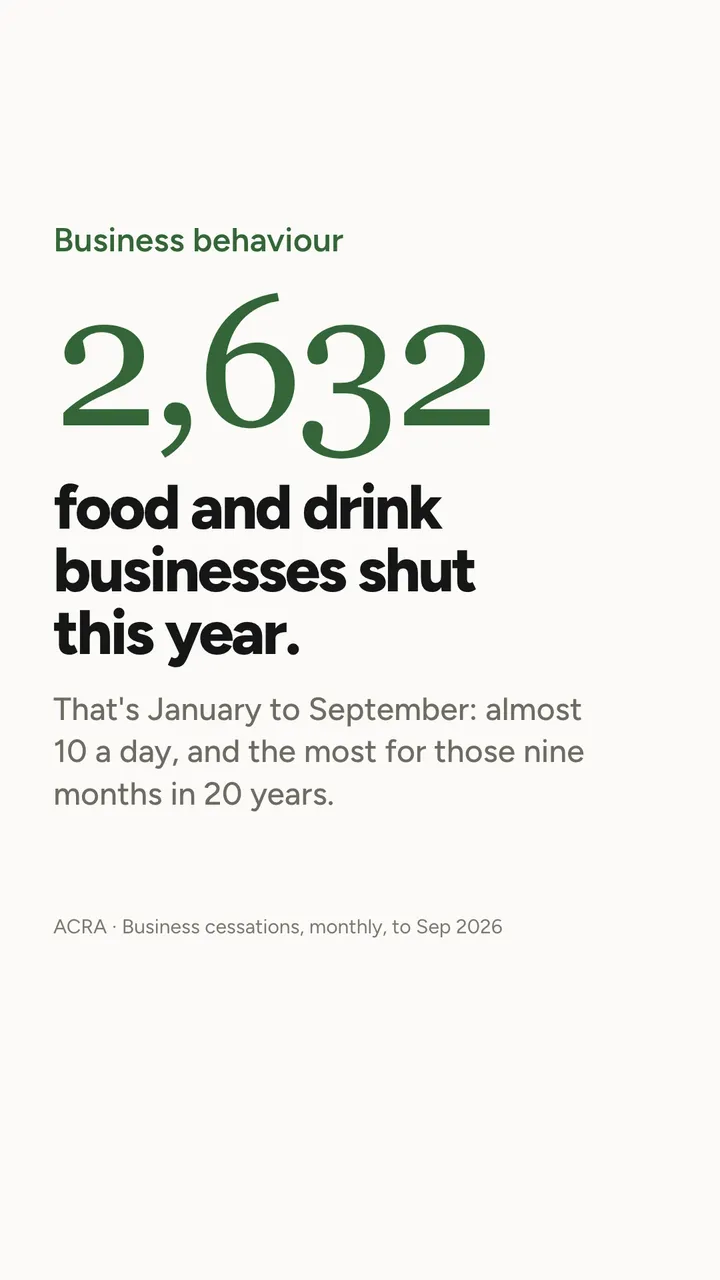
This one is my sister's café, multiplied. ACRA, the Accounting and Corporate Regulatory Authority, publishes how many businesses stop each month, by industry. Adding up the food and drink figures from January to September 2026 gives 2,632. That's the highest for those nine months in 20 years.
The "almost 10 a day" is simple division. January to September is 273 days. 2,632 divided by 273 is about 9.6 closures a day.
A fair caveat: a business stopping isn't always a business failing. Some owners retire or restructure, and F&B has a lot of openings every year too. But a 20-year high is still a signal, and it fits the slide before: if diners trade down, the restaurants and cafés in the middle of the price ladder feel it first.
What this means for you
If you're thinking of opening a small business, this is a number worth looking at before you sign a lease. For everyone else, it's a reminder that the places you love depend on regulars.
The things you can't skip are rising faster
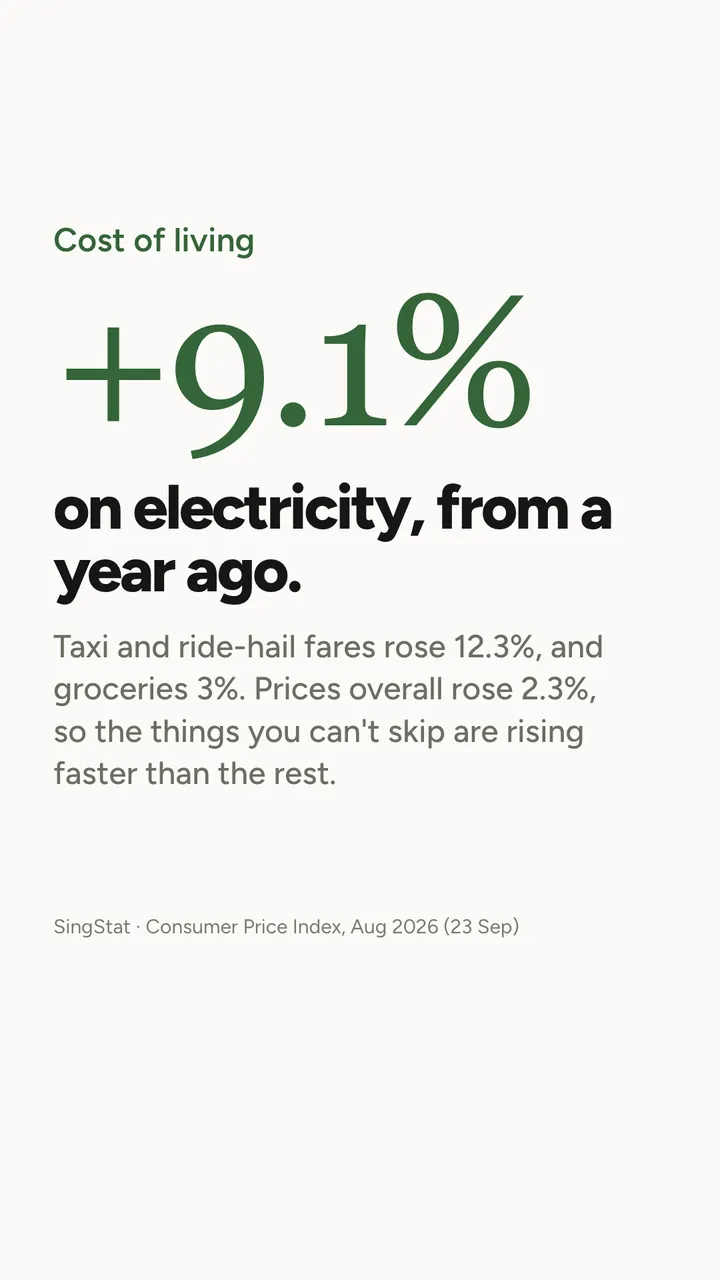
The Consumer Price Index (CPI) is SingStat's measure of how prices change for a typical basket of things households buy. When people say "inflation was 2.3%", they mean the whole basket cost 2.3% more than a year before. In August 2026, that's what it was.
But nobody buys the average basket. And inside it, some things went up a lot faster. Electricity was up 9.1% on a year before. Taxi and ride-hail fares were up 12.3%. Groceries were up 3%. Those are the things most households can't easily cut. You can skip a café. You can't really skip the electricity bill.
Here's what that looks like with a made-up household. Say the Tans paid $120 a month for electricity a year ago. Up 9.1%, that's $120 times 1.091, which is about $130.90. Their groceries were $800 a month. Up 3%, that's $824. Together that's roughly $35 more a month, or about $420 a year, for exactly the same life. If their pay rose by 2.3%, in line with prices overall, they'd still feel squeezed, because their own basket is heavier on the things that rose most.
These figures are for August. SingStat publishes a new month around the 23rd, so by the time you read this there may be a newer one on its page.
What this means for you
Work out your own inflation for two or three bills you can't avoid. Take this year's bill, divide it by the same month last year, and subtract 1. If your electricity was $120 and is now $131, that's 131 divided by 120, minus 1, which is about 9%. That's a more honest number for planning than the headline.
More layoffs, and longer to find work again
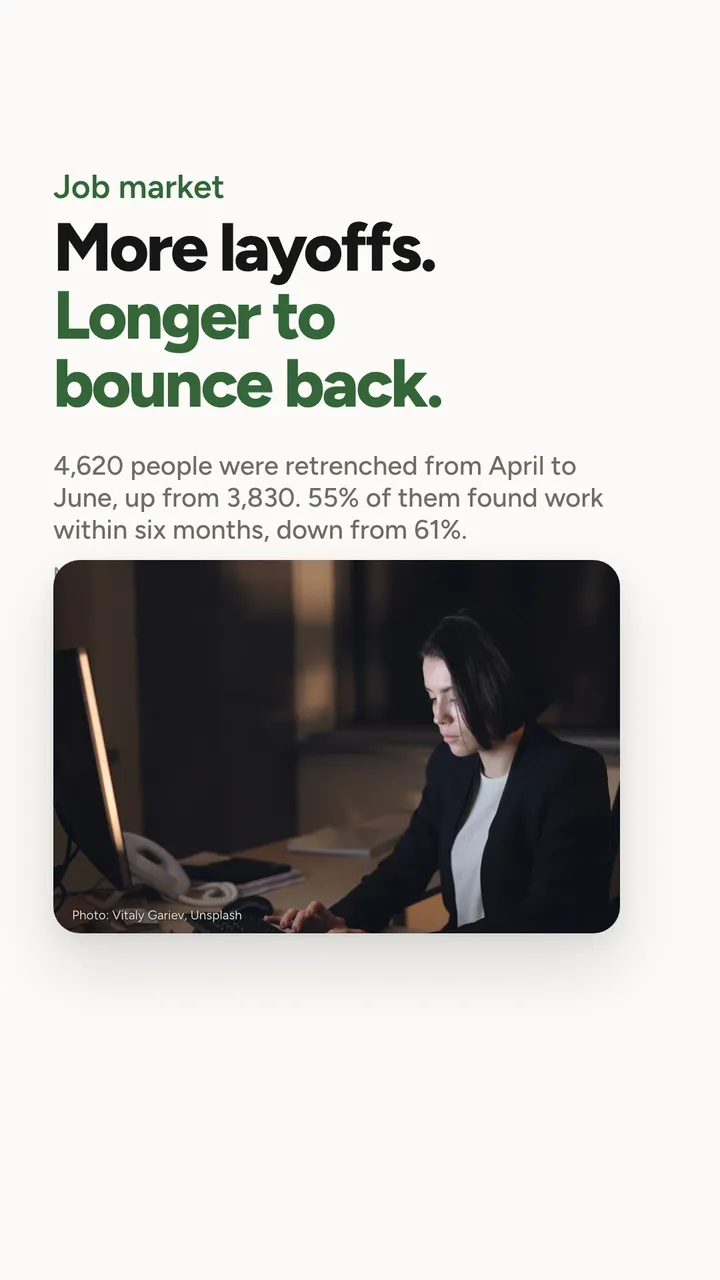
Retrenchment is when an employer lets someone go because the job itself is no longer needed, rather than because of anything the person did. The Ministry of Manpower counts it every quarter. From April to June 2026, 4,620 people were retrenched, up from 3,830. That's 790 more people, a rise of about 21%.
The second number matters just as much. MOM also tracks how many retrenched residents find a new job within six months. That went from 61% to 55%. Put the other way round, the share still looking for work after six months went from 39% to 45%.
This is exactly why an emergency fund matters, and why the usual guide is a range rather than one number. MoneySense suggests keeping three to six months of expenses set aside for emergencies.
Here's the arithmetic for a made-up example. Say Priya, 36, spends $3,200 a month on rent or her loan, food, transport, bills and insurance. Three months is $9,600. Six months is $19,200. If she has $12,000 set aside, she's covered for $12,000 divided by $3,200, which is 3.75 months.
What this means for you
Count your emergency fund in months, not dollars. Divide what you have set aside by what a month actually costs you. The answer is usually more useful than the balance. I keep mine in a separate savings account for exactly this reason, so it doesn't feel like spending money.
A record S$9.64 billion in card bills rolled over
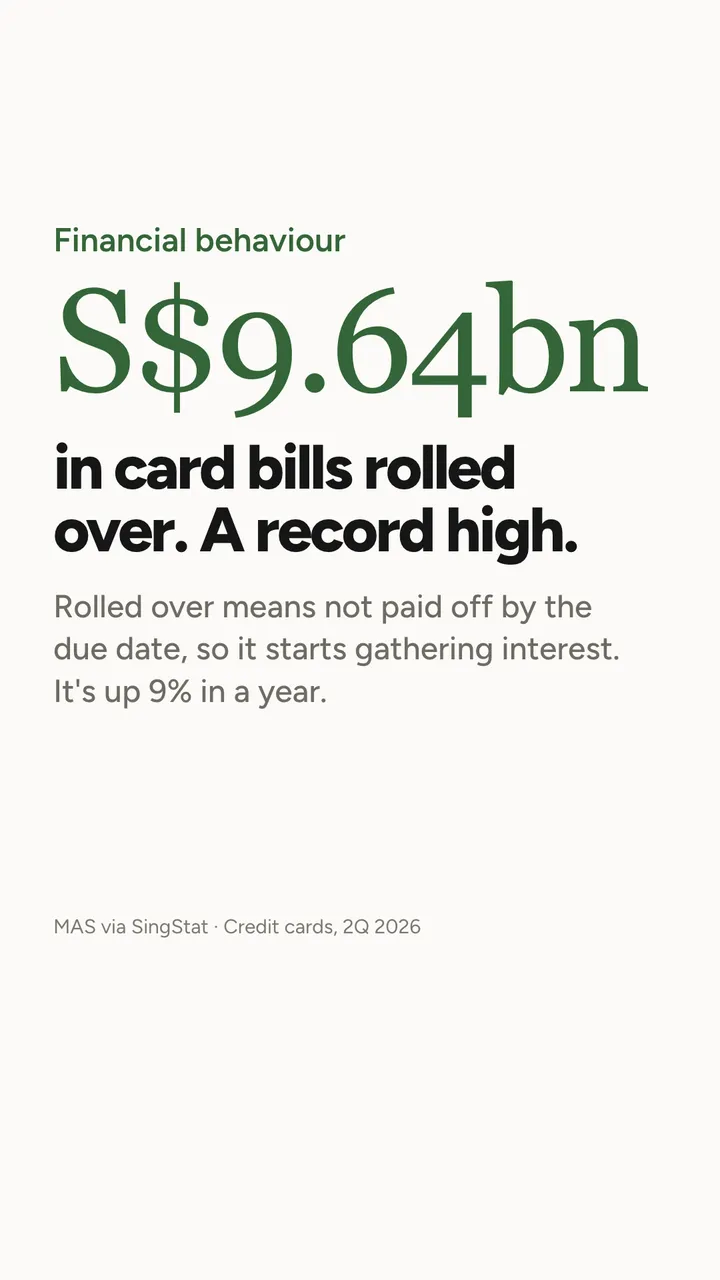
When your card statement arrives, you can pay the full amount, the minimum, or anything in between. Whatever you don't pay by the due date is rolled over: it carries into next month, and the bank starts charging interest on it. MAS publishes the total rolled over across all cards in Singapore, and in the second quarter of 2026 it was S$9.64 billion. That's the highest on record, and 9% more than a year before.
A fair caveat: more people and more spending push a total like this up over time, so a record by itself isn't alarming. But 9% in a year is well ahead of prices overall, at 2.3%.
The reason it matters is that card interest is expensive. The exact rate is on your statement, and it's usually much higher than any loan you'd take out on purpose. Here's an illustration with a round rate. Say a card charges 27% a year and you carry $2,000. That's about 2.25% a month, so roughly $45 of interest in the first month alone. Keep paying only part of it and next month's interest is charged on this month's interest too.
What this means for you
Find the interest rate on your own card statement. If you're carrying a balance, it's worth putting that rate next to what your savings earn. The gap is usually wide, and it's what the balance costs you every month it stays.
Fewer weddings, fewer babies
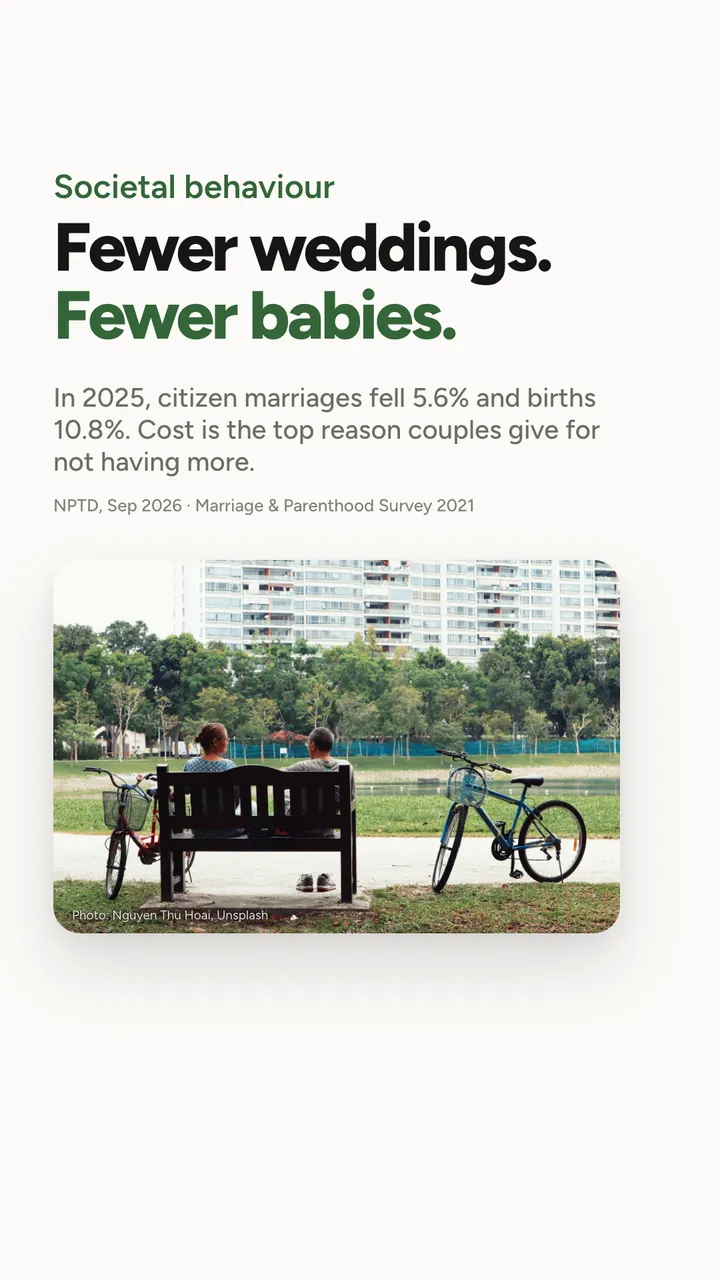
This slide is the slowest-moving of the six, and the most personal. The National Population and Talent Division reported in September 2026 that citizen marriages in 2025 fell 5.6%, and citizen births fell 10.8%. In the government's Marriage & Parenthood Survey (2021), the most common reason couples gave for not having more children was cost.
Big life decisions aren't made from a spreadsheet, but they are made by people looking at what a home, a wedding and a child would cost. When those numbers feel heavy, people wait.
I got married this year, so this one isn't abstract for me. A wedding budget is a few very large numbers, a lot of small ones, and deposit dates that come earlier than you expect. What helped most was seeing all of it in one place.
What this means for you
If a big life step is on your mind, it's worth writing down what it would actually cost and over what time. A goal with a number and a date is much less frightening than a vague feeling that it's "too expensive". I wrote about setting money up as a couple in managing money as a couple.
Is your cash ready for a squeeze?
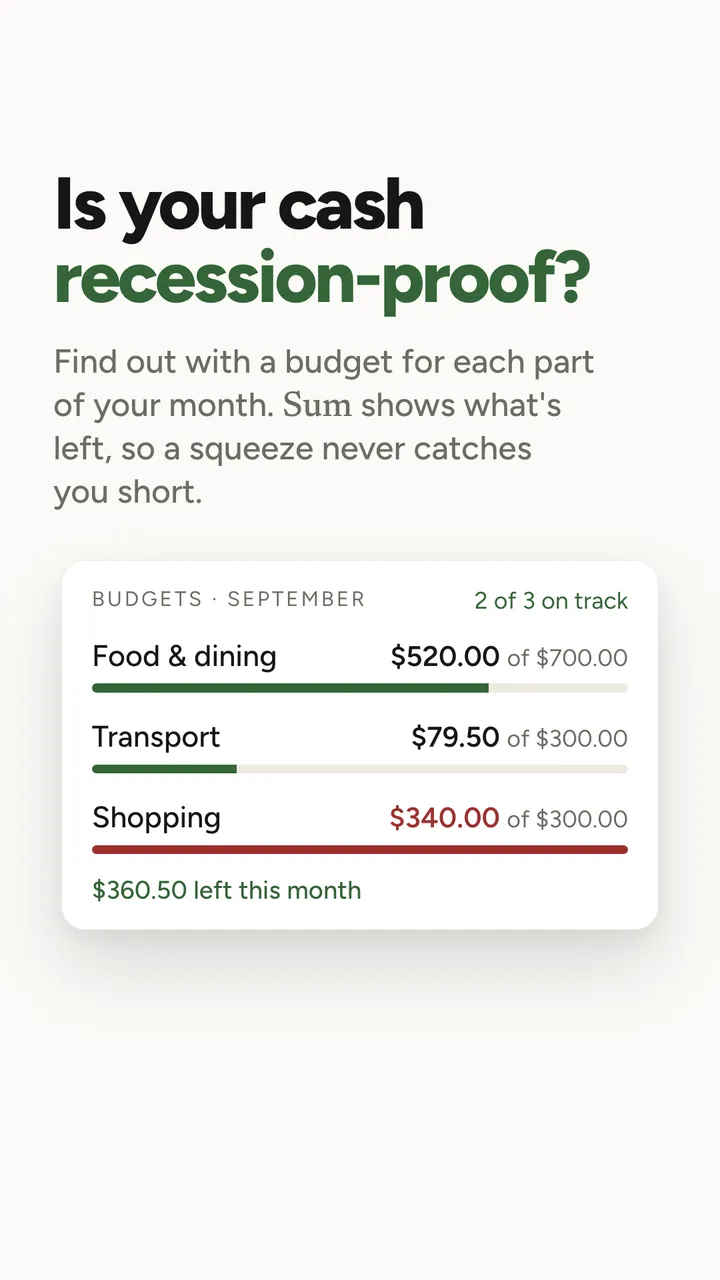
None of the six signs is in your control. What is in your control is how much warning you get. A budget for each part of your month is a monthly limit for a few categories, food, transport, shopping and so on, so you can see what's left in each as the month goes.
The slide shows a sample month in September, with three budgets:
| Budget | Spent | Limit | Left |
|---|---|---|---|
| Food & dining | $520.00 | $700.00 | $180.00 |
| Transport | $79.50 | $300.00 | $220.50 |
| Shopping | $340.00 | $300.00 | $40.00 over |
Add up what's left and take away the overspend: $180 plus $220.50 is $400.50, minus $40 is $360.50 left for the month, which is the line at the bottom. Two of three are on track. The useful thing is that the shopping overspend shows up mid-month, while there's still time to take it out of something else, not at the end when the card statement arrives.
A squeeze is much easier to handle when you already know where the slack is. I went into why budgets work better with a few categories than with every line in the psychology of budgeting.
What this means for you
Start with three categories, the ones you spend the most on, and a limit for each that's close to what you actually spent last month. Tighten them later. A budget you keep beats a perfect one you abandon in week two.
Make every dollar visible
An invisible recession is, more or less, a gap between what the big numbers say and what your own numbers say. The big ones you can't change. Your own you can at least see.
If you only remember three things
- A strong GDP figure is about the economy, not your household. Growth this quarter came mostly from chips, and the prices you can't skip, like electricity and rides, have risen faster than prices overall.
- Count your emergency fund in months of spending. Fewer retrenched people found work within six months this year, which is a good reason to look at the number again.
- Know your card's interest rate. A record amount of card debt is being rolled over, and interest on a carried balance costs far more than most people expect.
How I keep track of this
I open Sum on the 1st of each month with a kopi and import last month's card statements. Sum reads them and sorts every line into a category, and the first things I look at are my budgets: food, transport and shopping, the three biggest for me. When one is running hot I can see it, which is most of the battle.
Sum also reminds me before each bill is due, and because my accounts, cards and CPF sit in one net worth, I see the emergency fund in proportion to everything else.
Spending by category, budgets, bill reminders and goals are on Sum's free plan, and Sum is free to start.
We post a carousel most days on TikTok and Instagram, and the longer version lands here. These figures are as at 22 October 2026, and several get updated every month or quarter. If one looks out of date by the time you read this, email me at [email protected] and I'll update it.
As for my sister, I sent her the F&B slide that weekend. She replied with a sad face, then: "So now where we get coffee?" There's a coffee shop under her hospital block. It's cheaper, and she says the kopi is better. Trading down, in one message.
Talk soon, Brandon

Sum is launching in Singapore soon.
Your banks, cards, CPF and HDB flat, added up into one net worth. Statements sorted, card caps tracked, bills remembered.
Brandon · Finance team, Sum
Brandon is on Sum's finance team in Singapore. Brandon reads the CPF Board, IRAS and MAS updates so you don't have to, and turns our carousels into the longer version. Questions, corrections or something to share? Email Brandon at [email protected].
Got something interesting to share?
A money story, a question, something we got wrong, or a tip other Singaporeans should hear. Reach out to me at [email protected], or leave your email and I'll write to you.
Sources: MTI: GDP advance estimates for 3Q 2026, 14 Oct 2026; SingStat: Retail Sales Index and Food & Beverage Services Index, Aug 2026; ACRA: business entities ceased, monthly (data.gov.sg), to Sep 2026; SingStat: Consumer Price Index, Aug 2026 (released 23 Sep 2026); MOM: Labour Market Report 2Q 2026, 21 Sep 2026; SingStat Table Builder: credit card statistics (MAS), 2Q 2026; NPTD: Population in Brief and marriage and parenthood figures; MoneySense: Basic Financial Planning Guide.
Any app screens shown use sample data, not a real person's. Sum is free to start; some features need a paid plan.
Information only, not financial advice.